HOME > 写真 > 自然・風景 > 宇宙 > 惑星
10,000件の写真素材が検索されました。
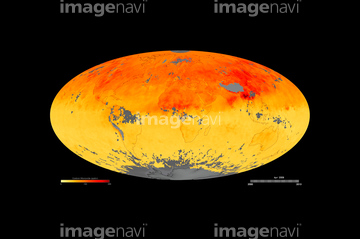
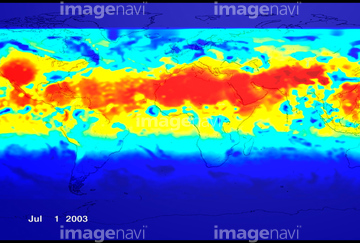
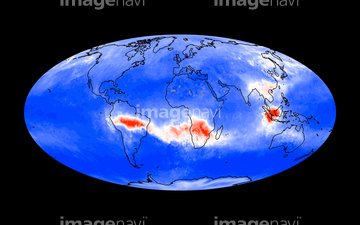
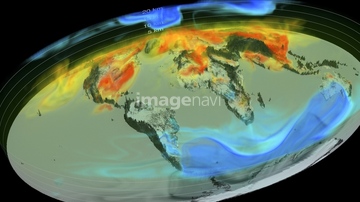
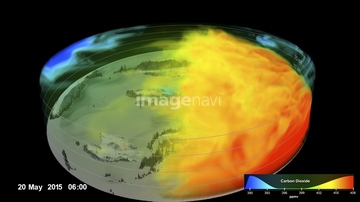
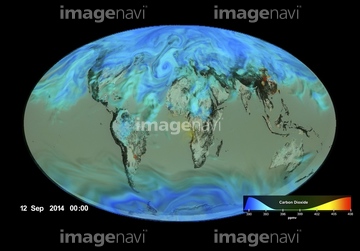
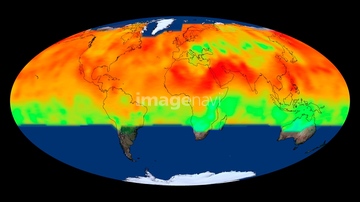
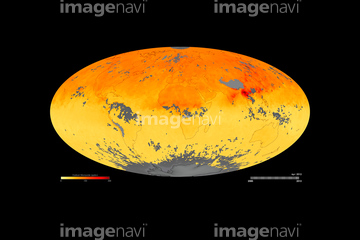
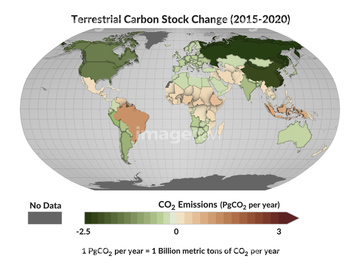
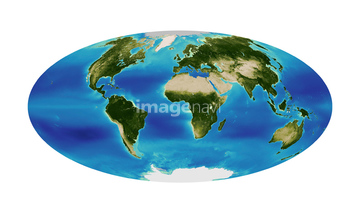
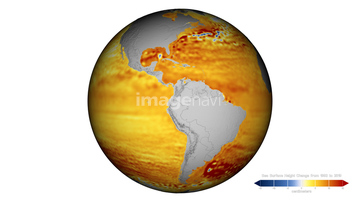
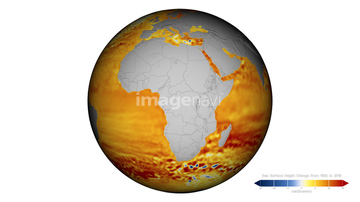
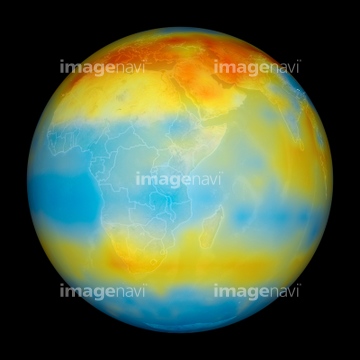
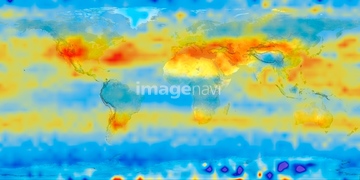
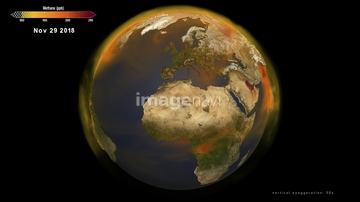
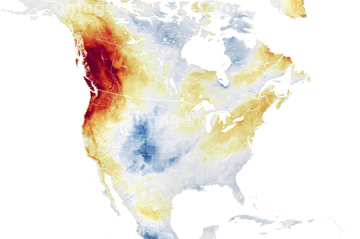
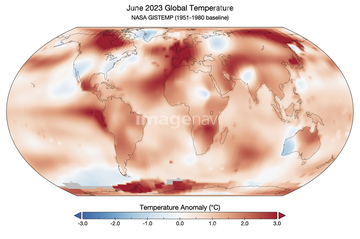
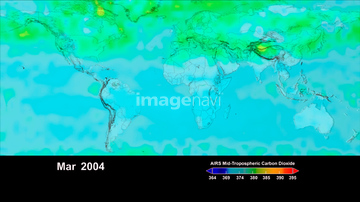
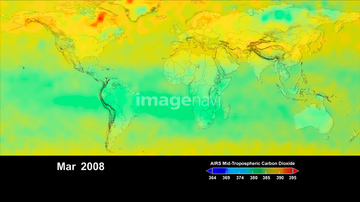
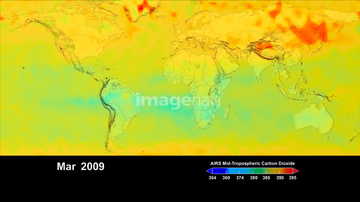
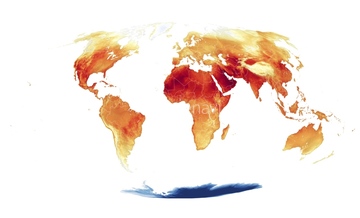
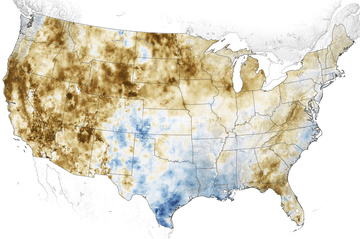
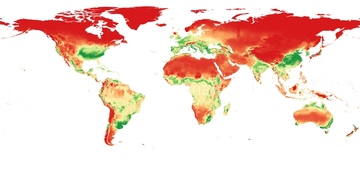
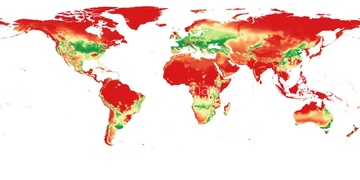
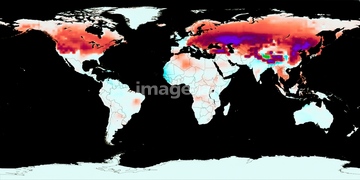
この検索結果には、Green balloon and climate change、19th Century anemometer、Carbon dioxide levels, Africa, 2003、Carbon dioxide levels, 2003、Carbon dioxide levels, Australia, 2003、Carbon dioxide levels, South Americaなどが含まれています。
64011192
64255396
64074885
64145778
64173782
64173783
64173784
64206258
64206259
64237590
64200590
64109467
64109468
64012257
64112895
64109421
64214495
64084877
64112894

64109563
64085887

64135837
64135845
64253424
64253425
64253426
64253427
64253428
64190779
64043474
64060471
64109502
64109503
64109505
64203337
64263464
64047887
64047888
64043083
14905225
64010525
64010526
64257903
64257904
64192700
64056070
64056071
64056072
64109483
64075588
64075590
14905224
14200281
64045964
64048838
64048839
64097621
64002338
64002339
17242710
64002332
64002333
64002342
64067805
64109501
64257529
64217602
64217603
64205161
64219634
64219636
64203141
64047394
64074112
17316347

17316351
64203129
64203130

99018004
64190451
22435624
64109746
64109748
64062174
64062175
64062206
64112898
64112899
64253422
30044270
21856550
12414402
12414403

12414405
64040308

64040309
64072420
00045929
64098672
16970887
16970888
16970889
16970890
16970891
16970892
16970893
16970894
16970895
16970896


| 次ページ |
