HOME > 写真 > 自然・風景 > 宇宙 > 地球
10,000件の写真素材が検索されました。
この検索結果には、2018 European heatwave, temperature anomaly map、Ocean surface pH, 1861、Ocean surface pH, 1945、Ocean-atmosphere CO2 exchange, 1861、Ocean-atmosphere CO2 exchange, 1945、Ocean surface pH, 2015などが含まれています。
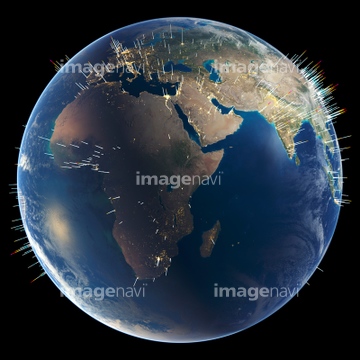
64203130
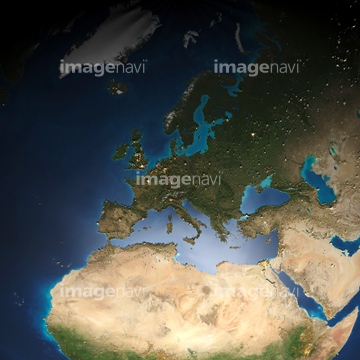
64201796
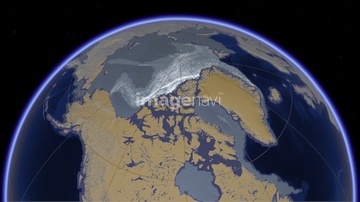
64201797
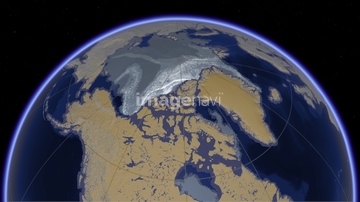
64201798
64201799
64203129
64201808

64109527

64109558
64201791
64262548

64109563
64201790
64254063
64218100
64256538

64109489
64109490
64254089

64109439

64109461

64109509

64109441

64109442

64109463

64109464
64105961
64105946
64109433
64109438
64109444
64109460

64109440

64109462

64109473

64109475
64105944


64045846
64053576

64106283
64144994
64190777
64109488
64112895
64105962

64109443

64109465
64109476
64043474
64194955
64262120
64262121
64257903
64257904
64011298
64011299
64011300
64011303

64011304

64011305

64011306
64010067
64187004
64014939
64208339
64091478
64130289
64112898
64112899
64253422
64188515
64188516
64160092
64047394
64040206
20562554

64109470
64109503
64109505
64203337
64040205

64041390

64041230
64186328
64186329
64186330
64186331
64098666
64040980
64112894
64014421
64014575
64105947
64203131
64015263
64071200
64071201
64071202
64071203
64071204
64071205
64067518
64067524
64109466
64109469
64037395
64010526
| 次ページ |
