HOME > 写真 > 自然・風景 > 宇宙 > 惑星
10,000件の写真素材が検索されました。
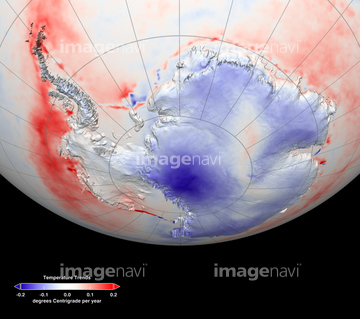
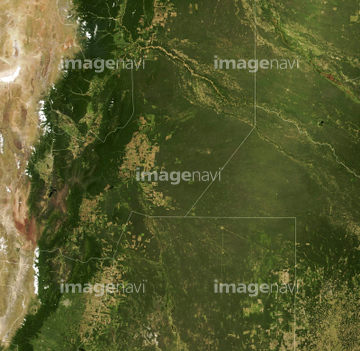
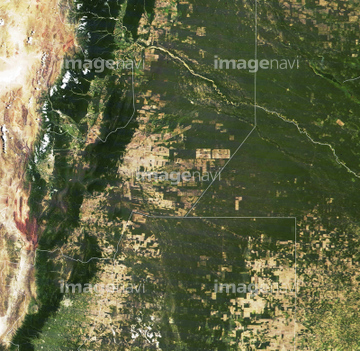
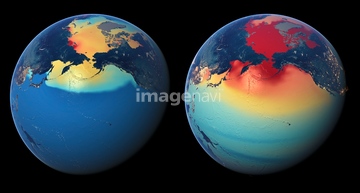
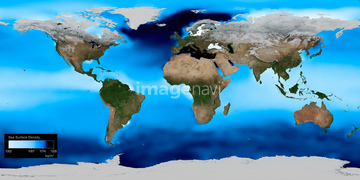
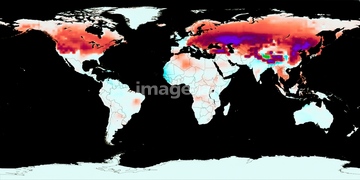
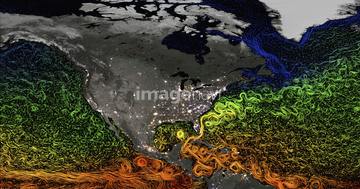
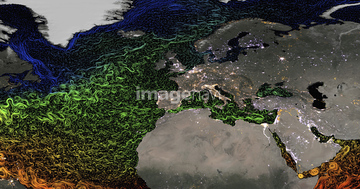
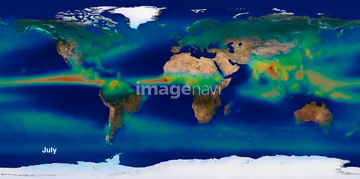
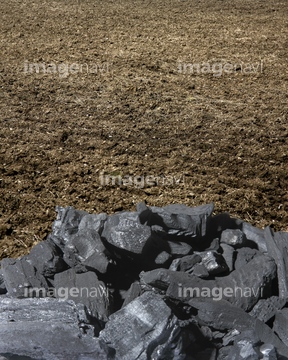
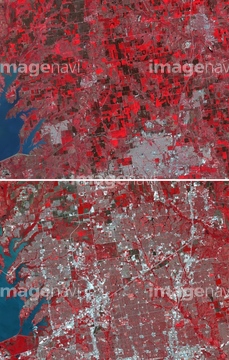
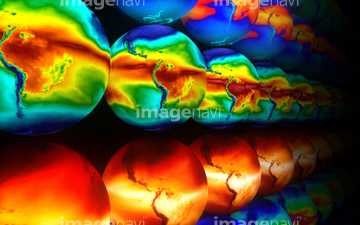
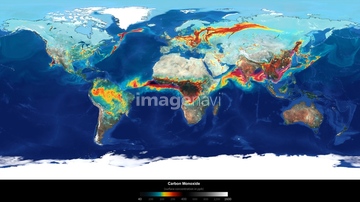
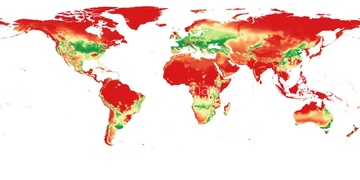
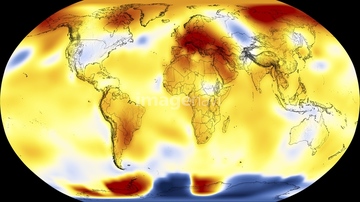
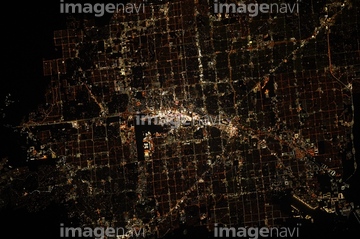
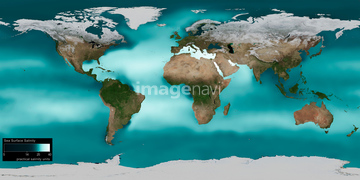
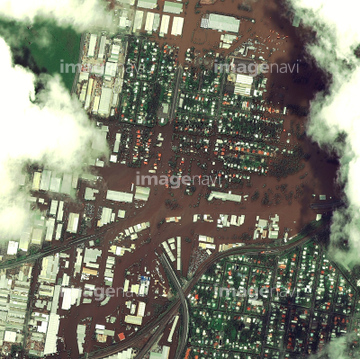
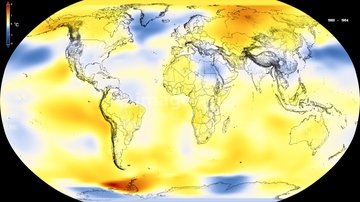
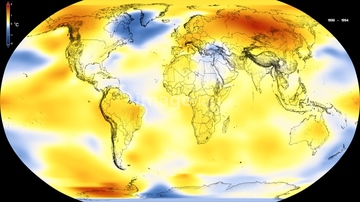
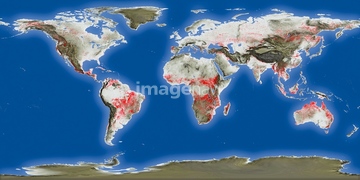
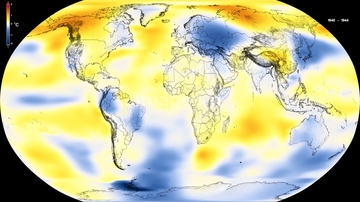
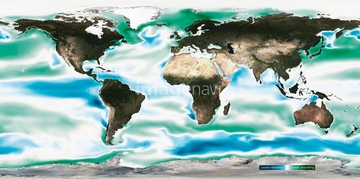
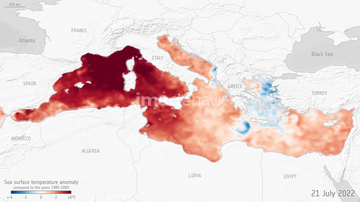
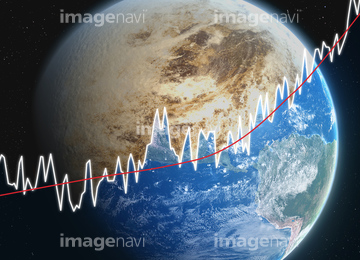
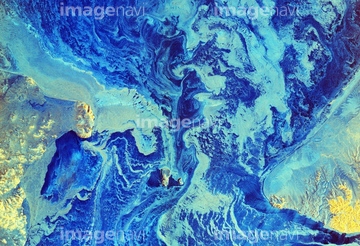
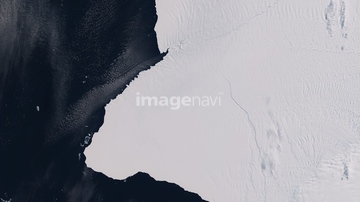
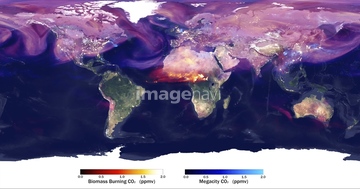
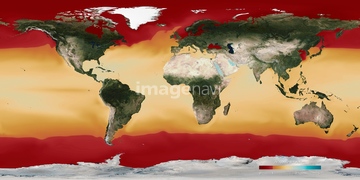
この検索結果には、Ocean current speed、Gulf Stream ocean temperature、Ocean temperature、Monthly global precipitation, May、Biochar enhancing soil quality, conceptual image、Urban sprawl in Texas, USA, infrared satellite ima…などが含まれています。
64105946
64105944
64014575

64106283

64145886
64105961

64109527

64109558
64160092
64045846
64047394
64014715
64105962
20506144
64014421

64109443

64109465
64262120
64262121
17235657
64254063
64254089
64067518
64067524
64014694
64201808
64040203
64040204
64040205
64040206
64014120
64253422
64014573
64188515
64188516
64201790
64190777
64203129
64203130

64041230
64067523
64071961
64040166
64201796
64201797
64201798
64201799
64112895
64166664
64145885
64131104
20544010
64014574

64051872
64051873
64040993
64088728
64014874
64112898
64112899
64185232
64185233
64185234
64185238
64185239
64185240
64185236
64046247

64041390
64109433
64109438

64109441

64109442
64109444
64109460

64109463

64109464
64256538
64112949
64113443
64106241

64109422
64044426
64044427
64015027
20570198
64015133
64201791
64105954
64105956
64059347
64059350
64179517
64179519

64058420
64058421
64208339
64086532
64166668

64109563
64194955

64109439

64109440

64109461

64109462

64109473

64109475
64109476
64253423
64253424
64253425
64253426
64253427
64253428
64113454
| 次ページ |
