HOME > 写真 > 自然・風景 > 宇宙 > 地球
10,000件の写真素材が検索されました。
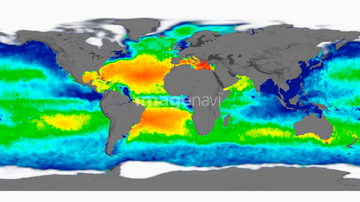
この検索結果には、Ocean surface pH, 1861、Ocean surface pH, 1945、Ocean-atmosphere CO2 exchange, 1861、Ocean-atmosphere CO2 exchange, 1945、Ocean carbonate saturation, 1861、Ocean carbonate saturation, 1945などが含まれています。
64203337
64257529
64218100
64217602

64109509

64109563

64109527

64109558
64256538
64200497
64262548

64109439

64109461
64109501
64257903
64257904
64047887
64047888

64109440

64109441

64109442

64109462

64109463

64109464

64109473

64109475
64109562
64253111
64253112
64192700
64263237
64262469
64203129
64256566
64109433
64109438
64109444
64109460
64109466
64109469
64109470
64109503
64109505
64011192
64067805
64200590
64014773
64062174
64062175
64141170
64208339

64109443

64109465
64109476
64188515
64188516
64188518
64053700

64041230
64079777
64263238

64067331
64014771
64058420
64058421
64085887
64260136
64253801

64109422
64109471

64185241
64014573
64044426
64044427
64255396
64203130
64109502
64040980
64253228
64188517
64092867
64092868
64045640
64045641
64045643
64045644
64045653
64045654
64045655

64041390
64185232
64185233
64185234
64185235
64185237
64185238
64185239
64185240
64185236

64106283
64071961
64141184
64098666
64098673
64098677
64098678
64098684
64098688
64098690
64098696
64098702
64059340
64059343
64059347
64059349
64059350
64059352
64059353
64059355
64059356
64059357
64072059
64072060
64168478
64097616

64109472
64129763
64075188
64075189
64075190
| 次ページ |
