HOME > 写真 > 産業・環境問題 > エネルギー・エコロジー > 環境破壊・汚染
10,000件の写真素材が検索されました。
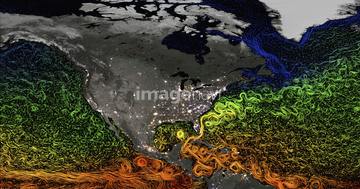
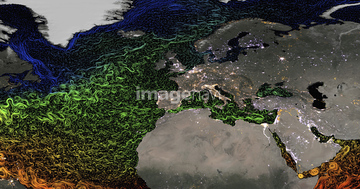
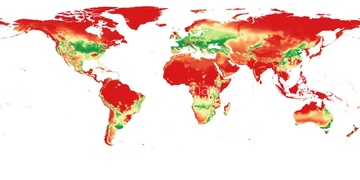
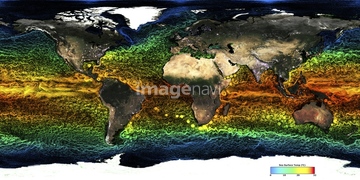
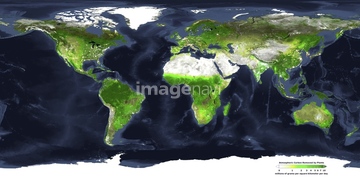
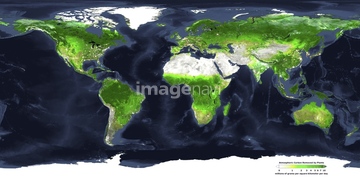
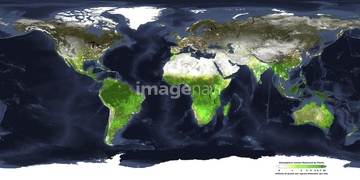
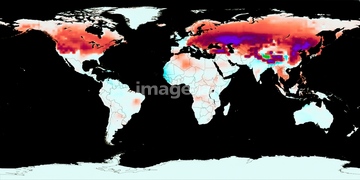
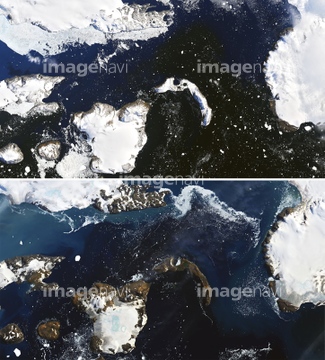
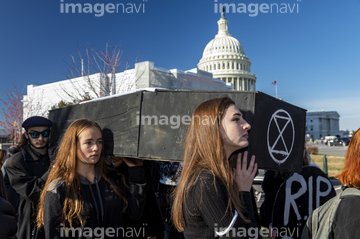
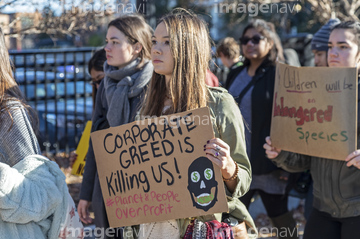
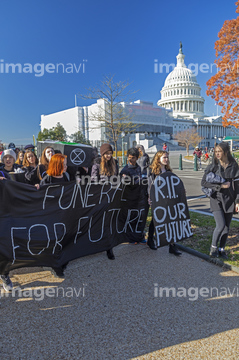
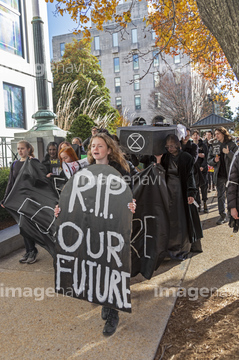
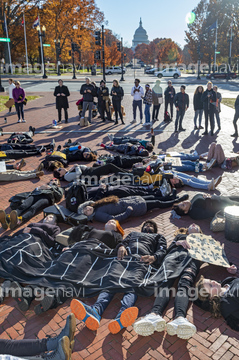
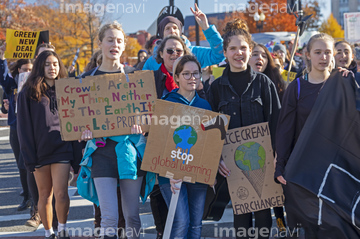
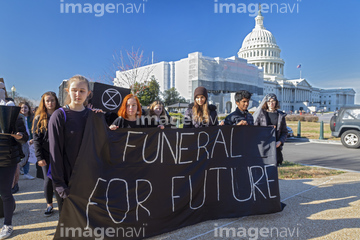
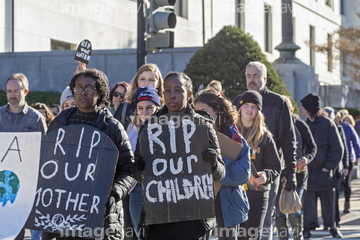
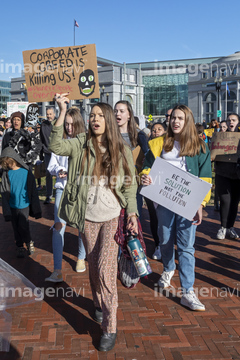
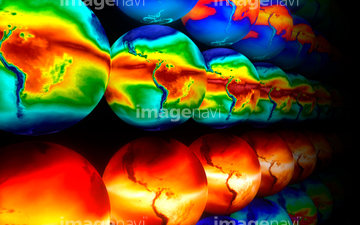
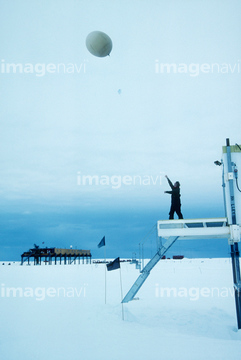
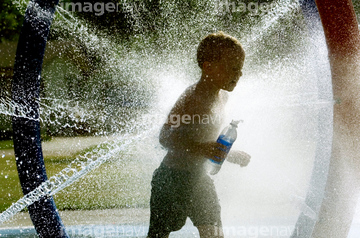
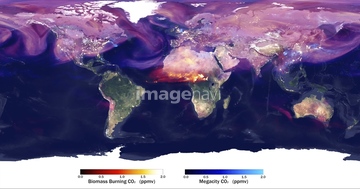
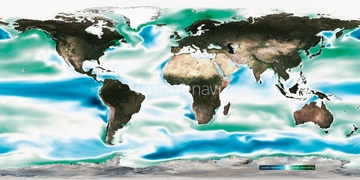
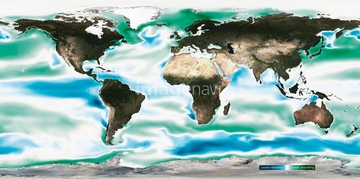
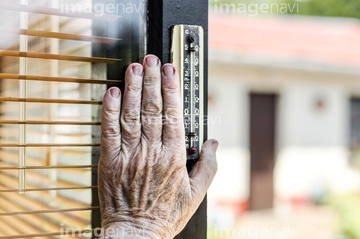
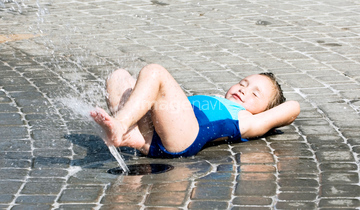
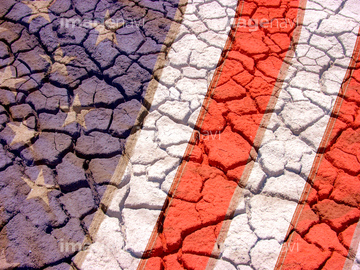
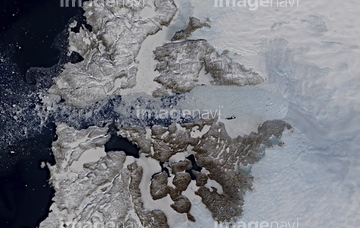
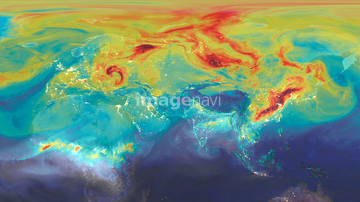
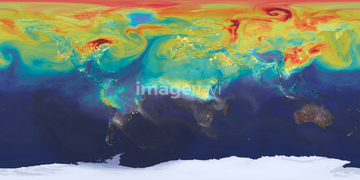
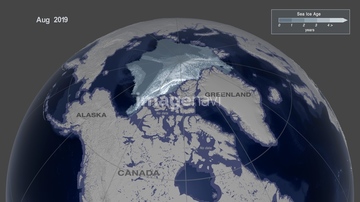
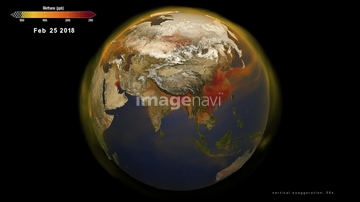
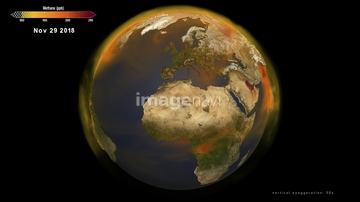
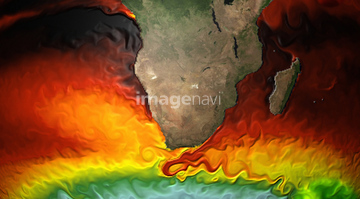
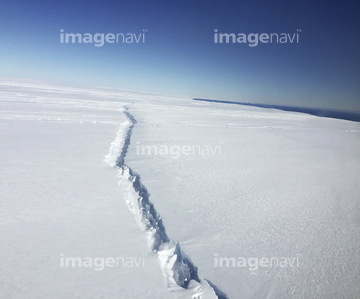
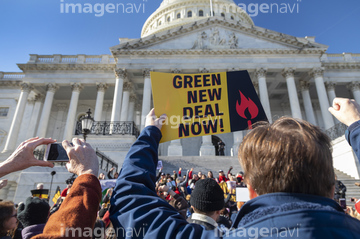
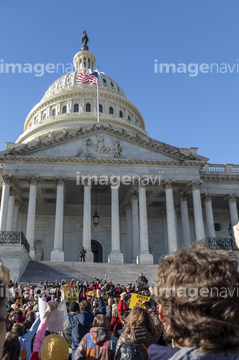
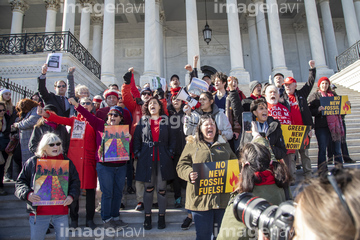
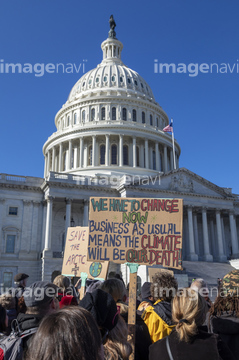
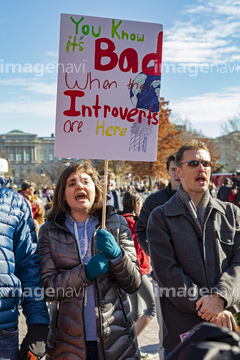
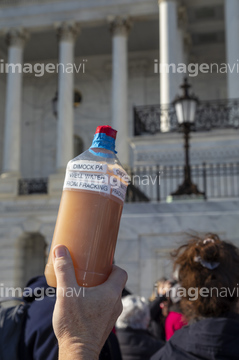
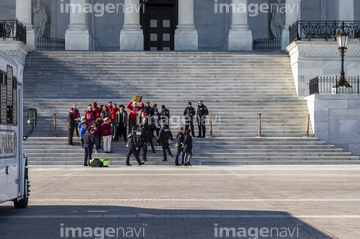
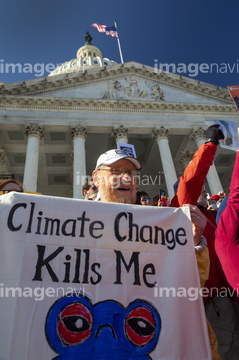
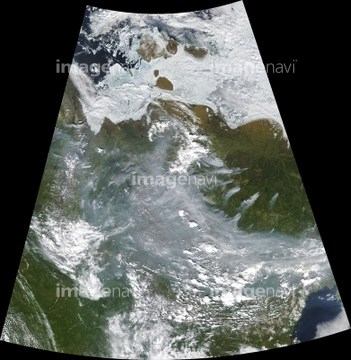
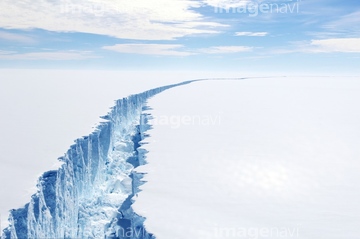
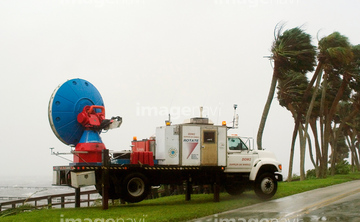
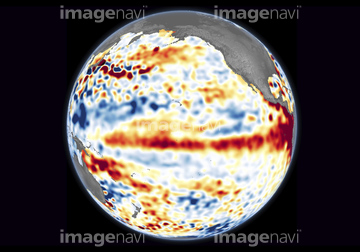
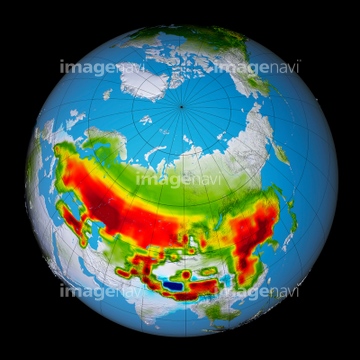
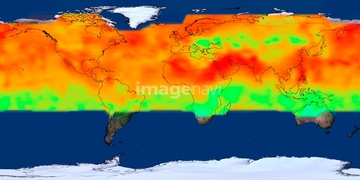
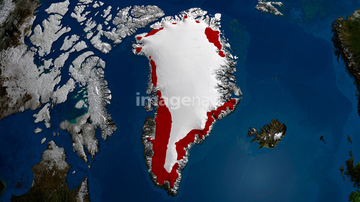
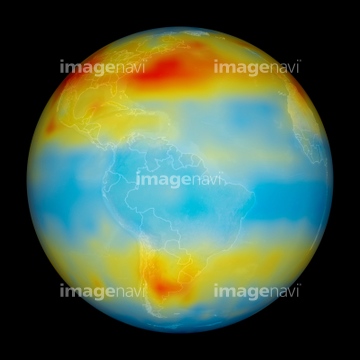
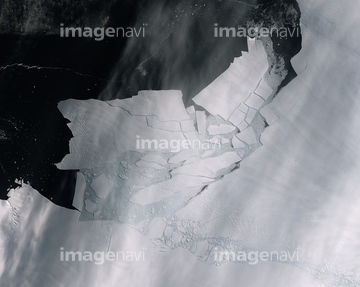
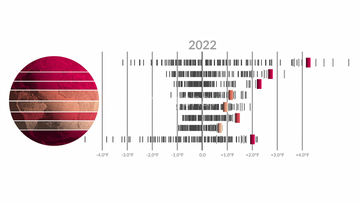
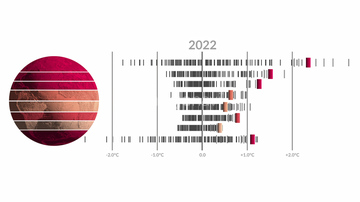
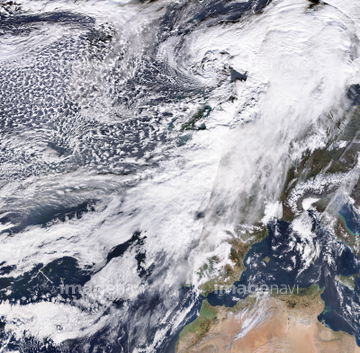
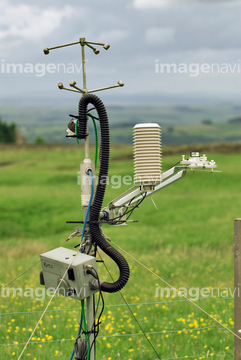
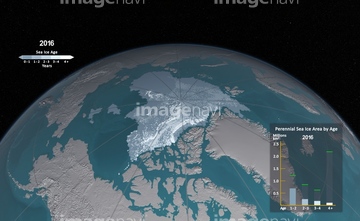
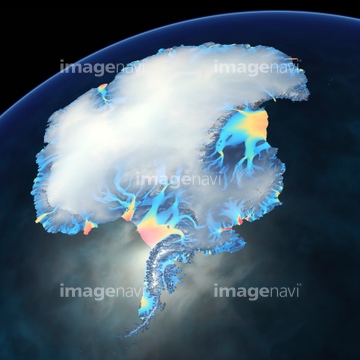
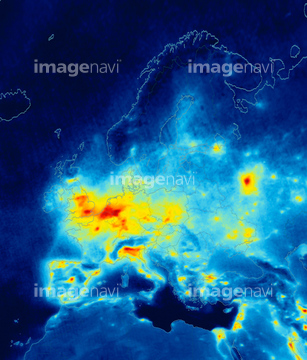
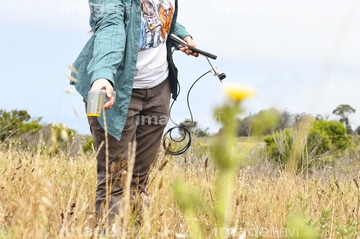
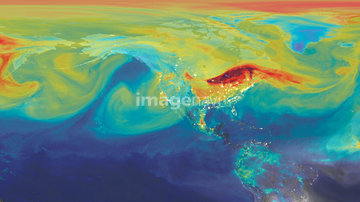
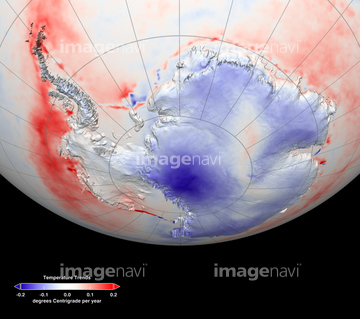
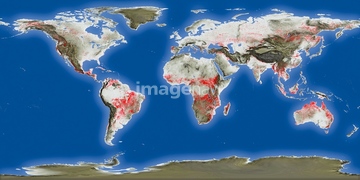
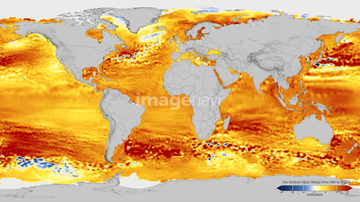
この検索結果には、Climate change protest, Washington DC, USA、Global water vapour simulation、Antarctic research station、Boy in sprinklers、Boy being sprayed with water、Boy in a fountainなどが含まれています。
64262548
64256538
64218100
64203337
64257529

64109527

64109558
64203129

64109509
64203130
64201808
64130289
64011298
64011299

64109441

64109442

64109463

64109464
64217602
64200497

64109439

64109461
64011300
64014773

64109563

64045846
64053576
64011303
64011304
64011306

64109440

64109462

64109473

64109475
64201790
64201791
17274214
64109433
64109438
64109444
64109460
64011029
64194955
64011305
64014939
64201796
64201797
64201798
64201799
20555808
64144994

64109443

64109465
64160092

64106283
64254063
64047394
64037388
64037390
64093935
64098696
64058141
64058146

64041230
64226657
64263237
64046247
64105944
64109476
64112895
64092867
64092868
64016322
64109470
64109503
64109505
64256566
64257903
64257904
64010526
64091478
64170965
64170967
64076587
64076588
64076589
64076590
64105947
64057966
64047483
64047484
20544010
64188515
64188516
64190777
64254089
64043474
64058136
64058140
64253422
64107311
64042397
00043257
00043258
64014573
64015277
64017211
64253111
64253112
64058062
64145886
| 次ページ |
