HOME > 写真 > 自然・風景 > 宇宙 > 惑星
10,000件の写真素材が検索されました。
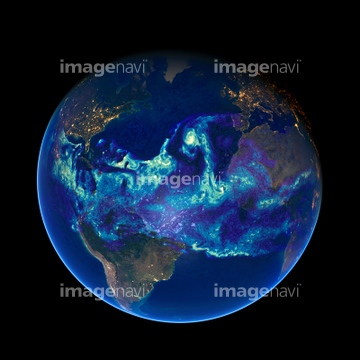
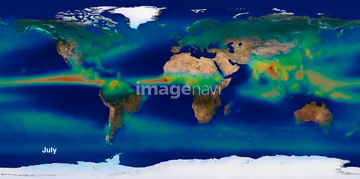
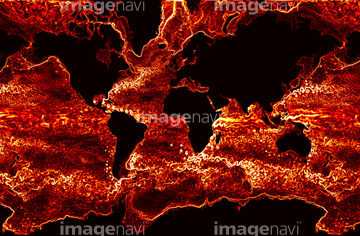
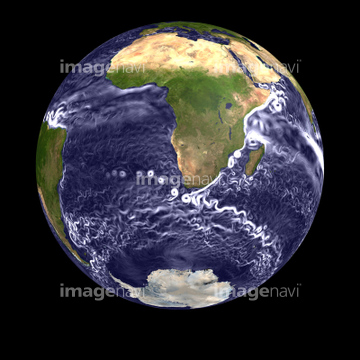
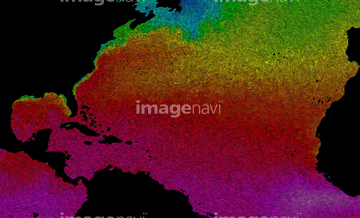
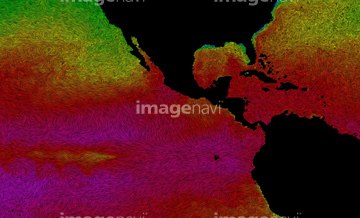
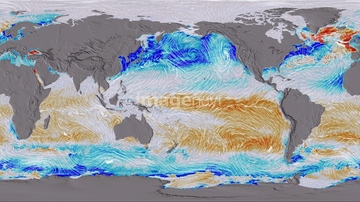
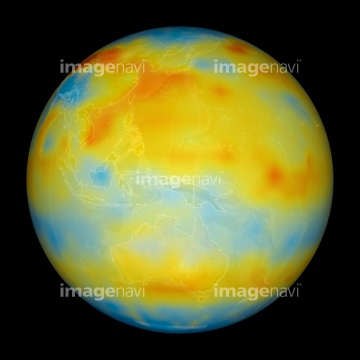
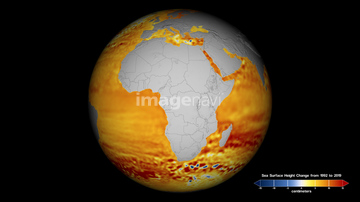
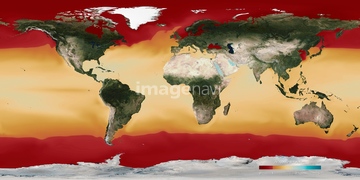
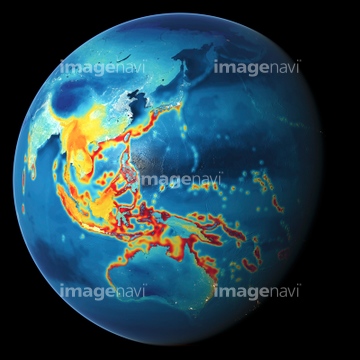
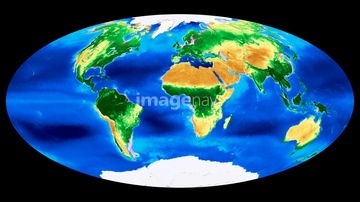
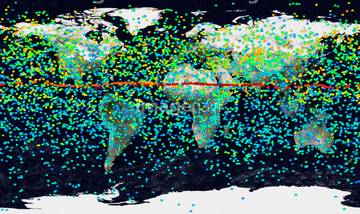
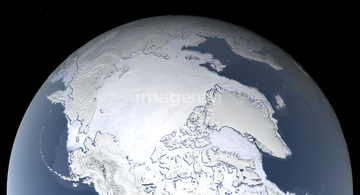
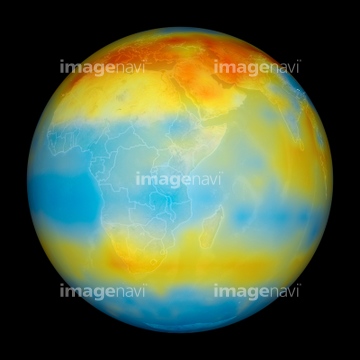
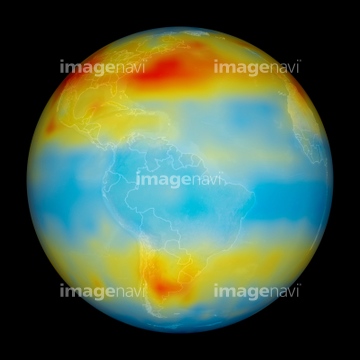
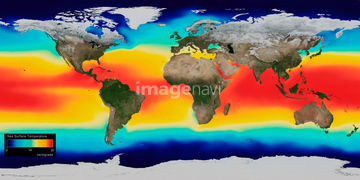
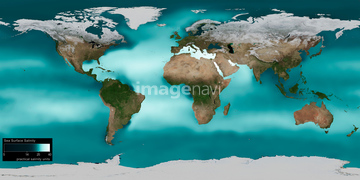
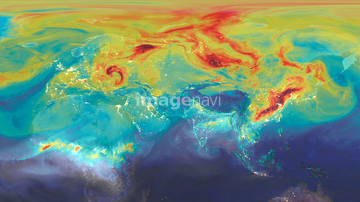
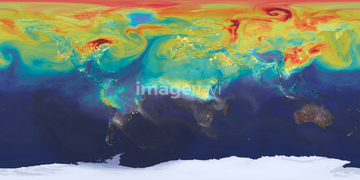
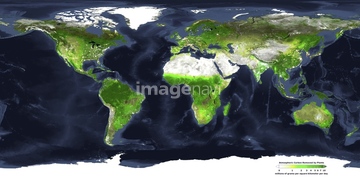
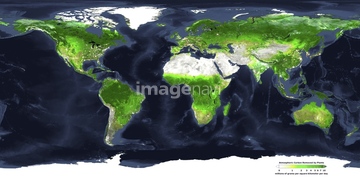
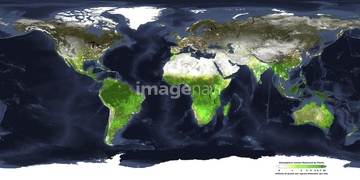
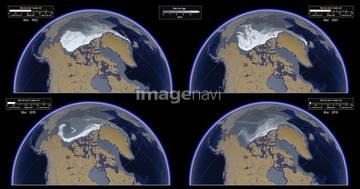
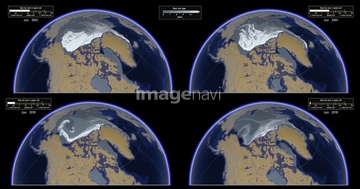
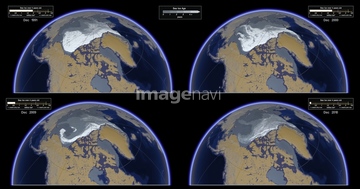
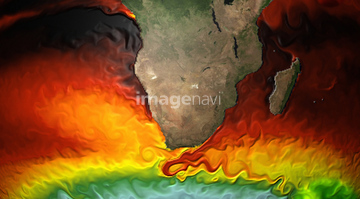
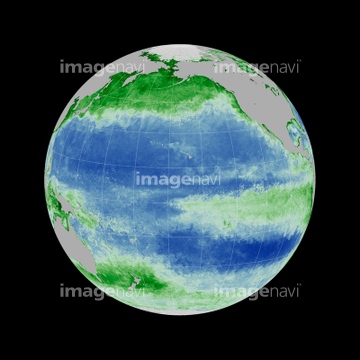
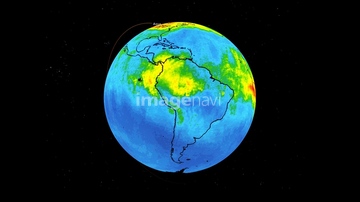
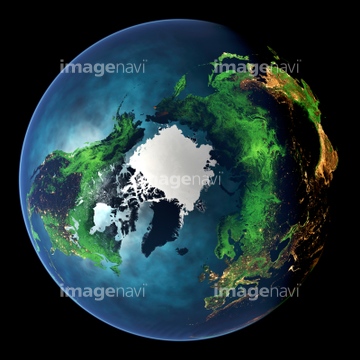
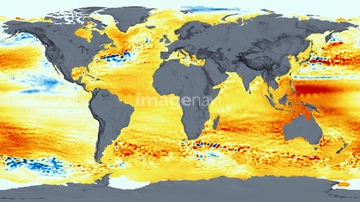
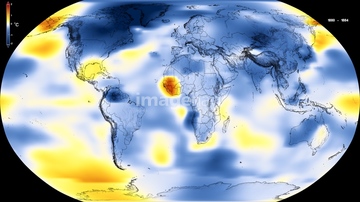
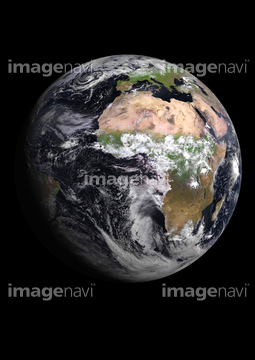
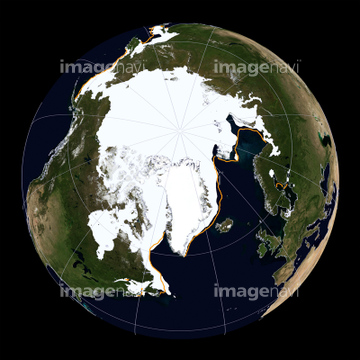
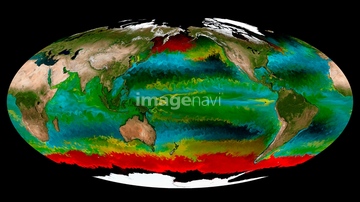
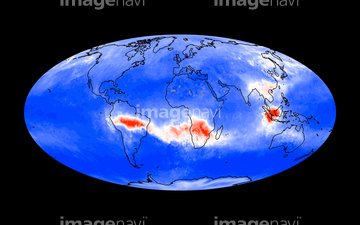
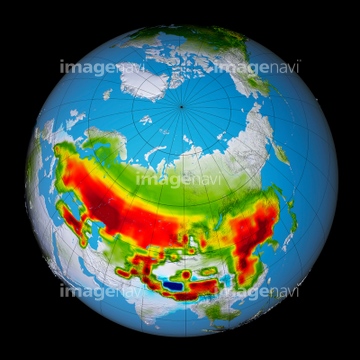
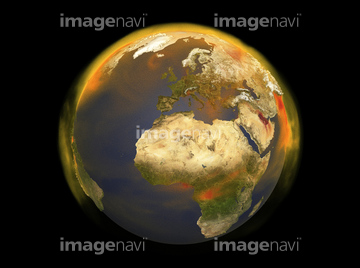
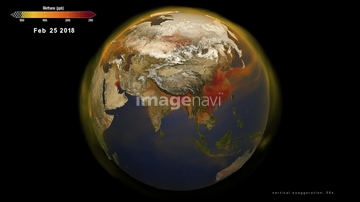
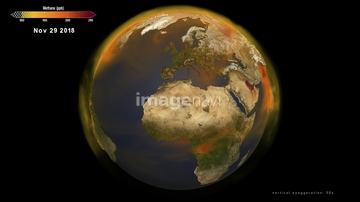
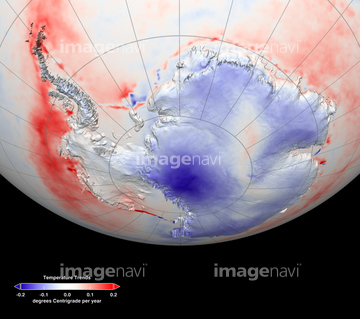
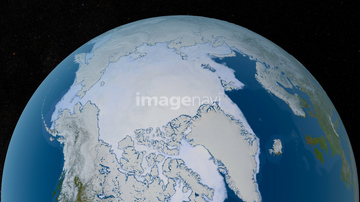
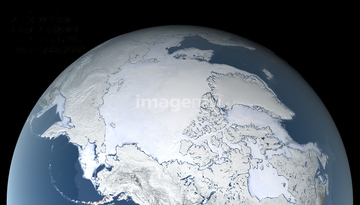
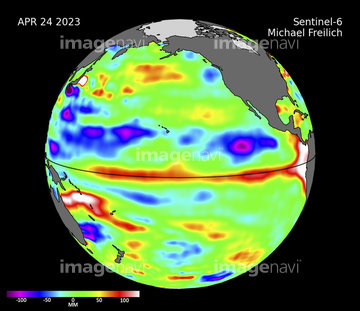
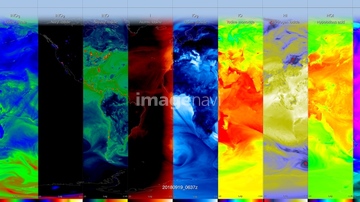
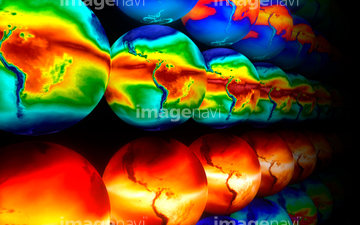
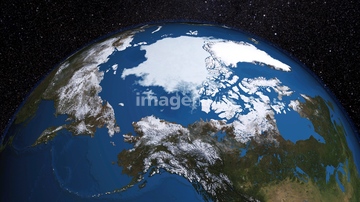
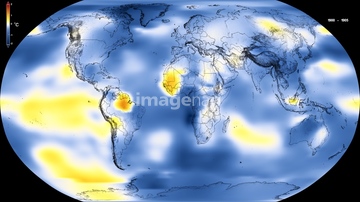
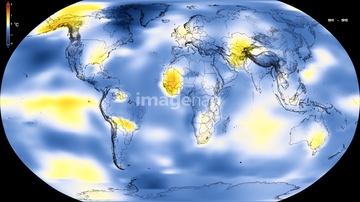
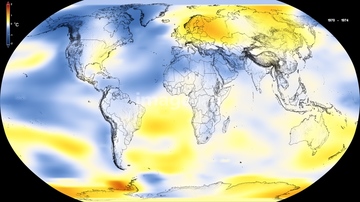
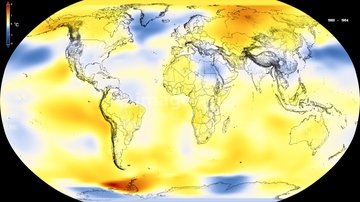
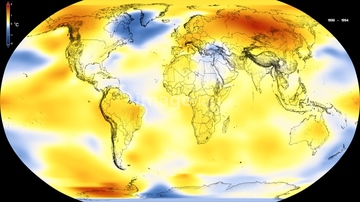
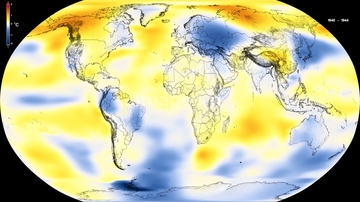
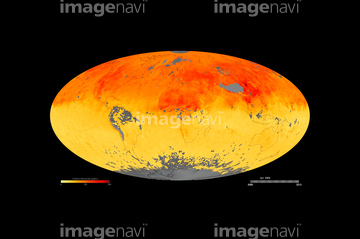
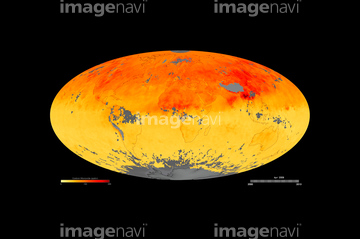
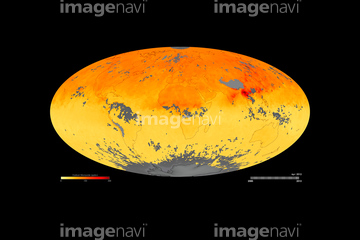
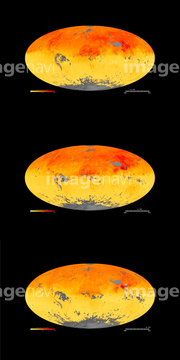
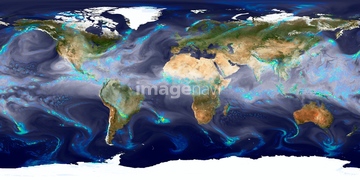
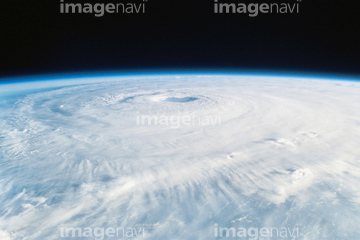
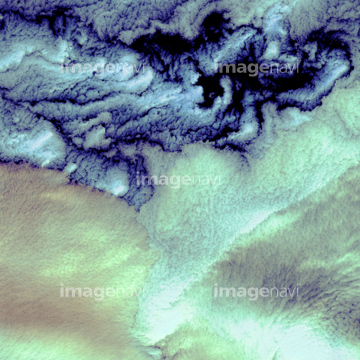
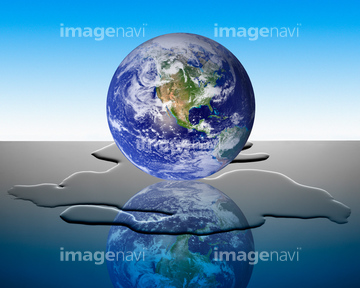
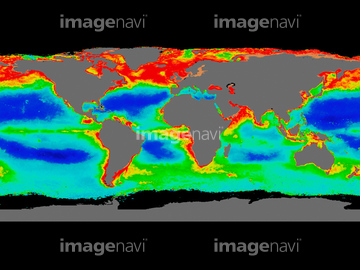
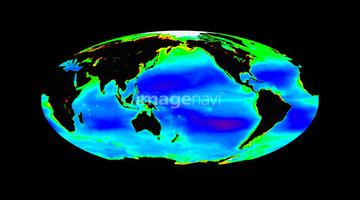
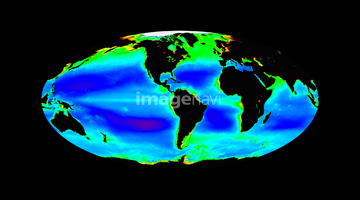
この検索結果には、Biodiversity in South-East Asia、Global biosphere, annual cycle、Global temperatures、Mount Pinatubo eruption, particle model、Arctic sea ice maximum, March 2023、Carbon dioxide levels, Africa, 2003などが含まれています。
64105944
64109444

64109461
64109460

64109465

64109462

64109463

64109464
64014575

64106283
64109433

64109439

64109527

64109558

64109422
64109438

64109443
64112895

64109440

64109441

64109442

64109473

64109475
64106823
64014120
64040203
64040204
64040205
64040206
64160092
64145886
64112894
64109466
64253423
64105962
64109476
64014715
64105951
64112900
64254088
64260979
64109502
64109505
64047394
64014573
64014574
64254063
64105949
64105960
64105961
64109469
64105953
64112898
64112899
64253422
64253424
64253425
64253426
64253427
64253428
64088728
64043083
64242042
64040980
64109470
64185232
64088450
64204970
64044426
64044427
64145885
64041383
64109503
64067805

64044794
64044795
64044796
64047887
64047888
64257411
64067518
64067524
64201791
64263237
64263238
64254089
64045846
64105772
64062174
64062175
64040166
64014670

64109563
64185233
64185234
64185238
64185239
64185240
64185236
17200257
64014696
64014697
64014698
64218473

64109472
64106821
64109471

64041390
64088667
64014831
64067523
64071961
64061242
64062373

64041230
64067331
64075588
64075590
64085875
64085876
64085879
64085880
| 次ページ |
