HOME > 写真 > 自然・風景 > 宇宙 > 地球
10,000件の写真素材が検索されました。
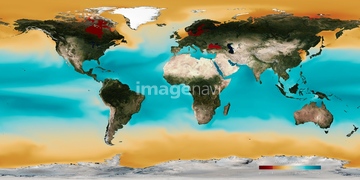
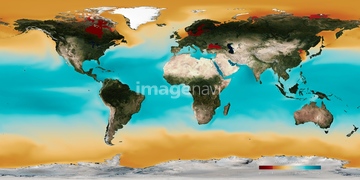
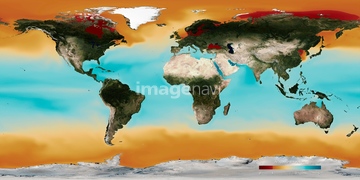
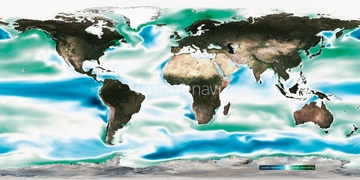
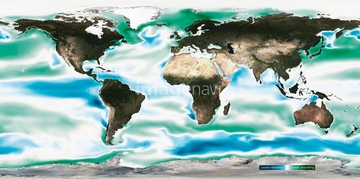
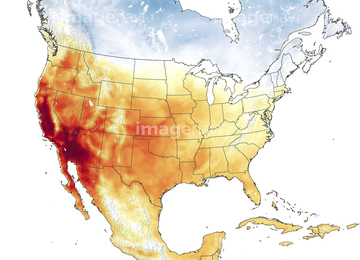
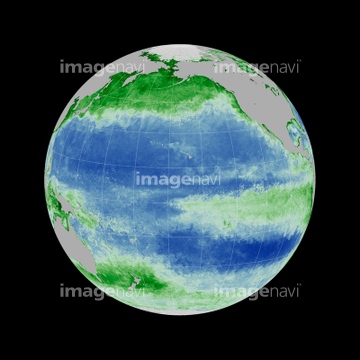
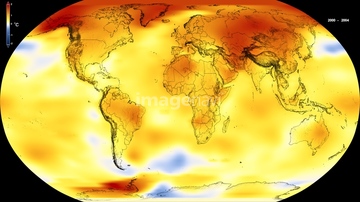
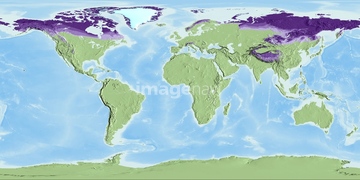
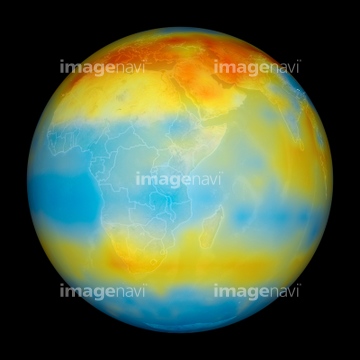
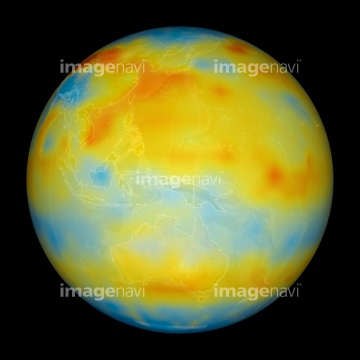
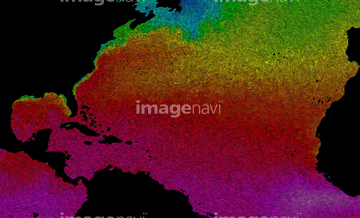
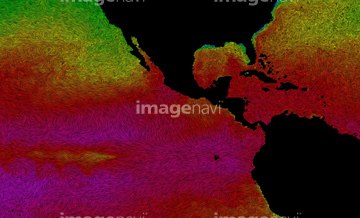
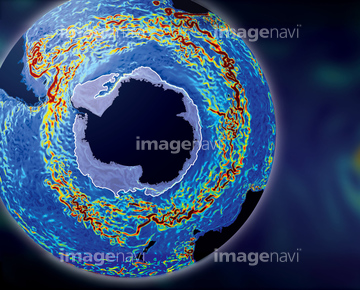
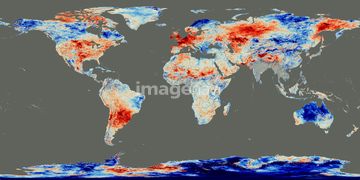
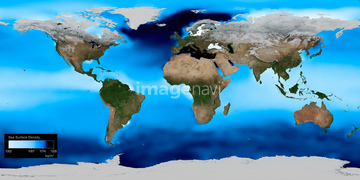
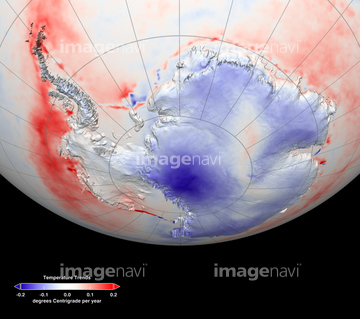
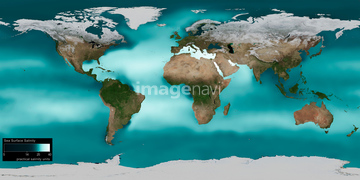
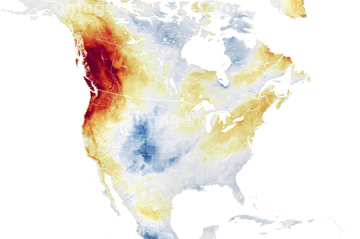
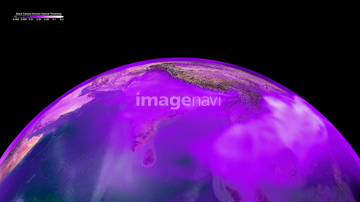
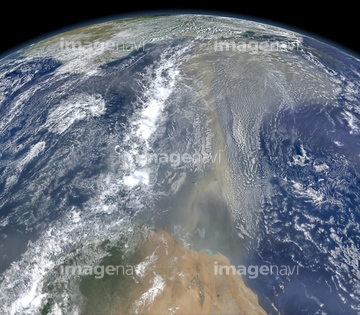
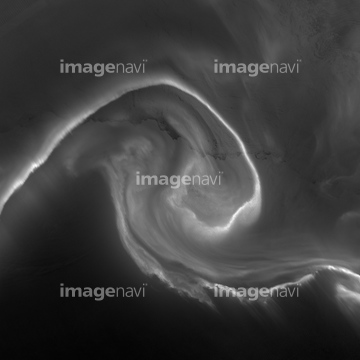
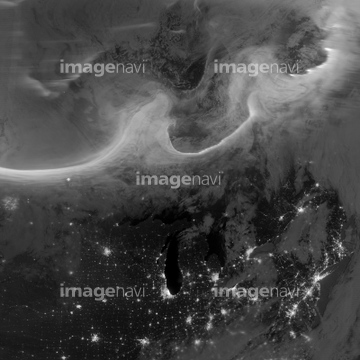
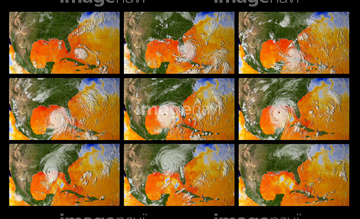
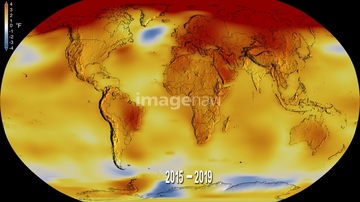
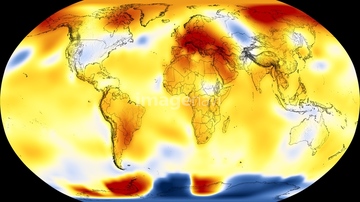
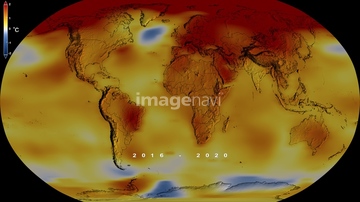
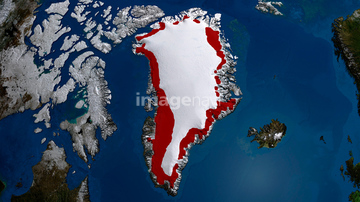
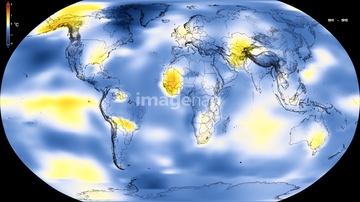
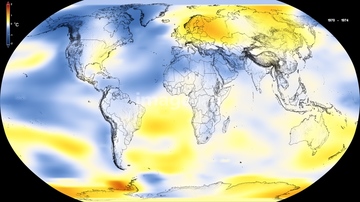
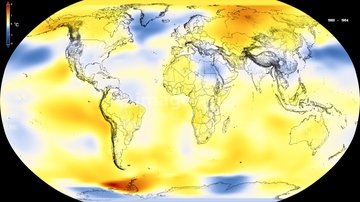
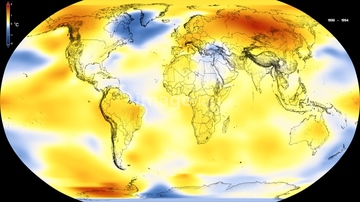
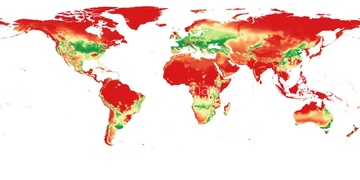
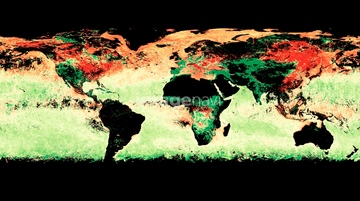
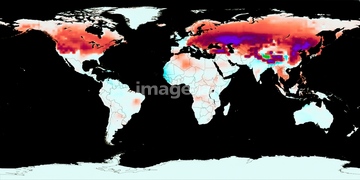
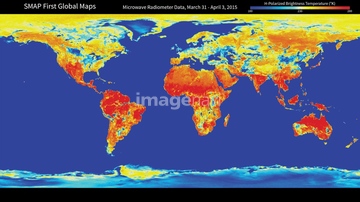
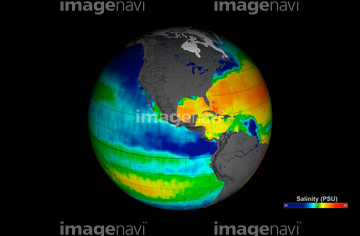
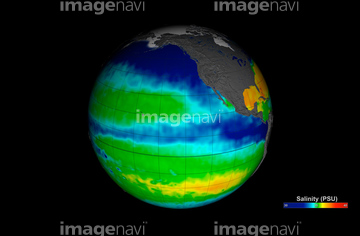
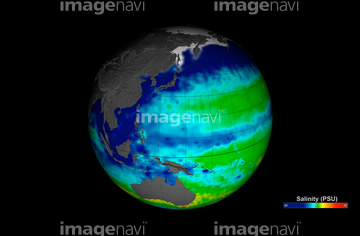
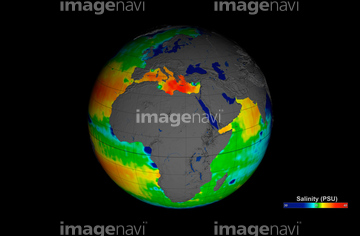
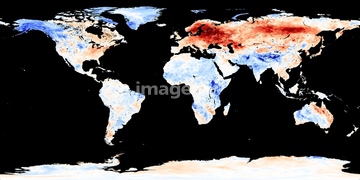
この検索結果には、Gulf Stream ocean temperature、Ocean temperature、Antarctic ocean current, computer model、Summer heatwave, 2006、Sea surface density, global map、Antarctic temperature trends, 1982-2003などが含まれています。

64109439
64109433
64109438

64109440

64109441

64109442
64109470

64109443

64109473

64109475

64109461
64109476
64109466
64109469
64109471

64109472
64109444
64109460

64109462

64109463

64109464

64109465

64109422
64218100

64109527

64109558

64041230

64109563
64109503
64203337

64109509
64188515
64188516
64185241

64041390
64109502
64109505

64106283
64047888
64092867
64053700
64040205
64040206
64014771
64014575
64040980
64067331
64011192
64105944
64044426
64044427
64040203
64040204
64109508
64041383
64109501
64014574
64188518
64092868
64058420
64058421
64045640
64045641
64045643
64045644
64045653
64045654
64045655
64257529
64152465
64152471
64057054
64064294
64050840


64086685
64067805
64011490
64087823
64088728
64109227
64043083
64242042
64061234
64061235
64061241
64061242
64062373
64046145
64044794
64044795
64044796
64047887
64075588
64075590
64260136
64262469
64263237
64014573
64009996
64009999
64010004
64010006
64208339
64109421
64257903
64257904
64192700
64092866
64185232
64185233
64185234
64185238
64185239
64185240
64190764
64185236
64188517
64203129
64203130
64219636
64109562
64098666
64086444
64078001
64078002
64078003
64078004
64078005
64200497
64109677
64218473
64062174
64062175
64040166
64014702
64067282
64067291
64067330
| 次ページ |
